

Summary: How Human Resource (HR) Directors can calculate the bottom-line return that their initiatives bring to the organization.
Calculating HR’s Direct Impact on the Bottom Line
“Show me the money” has become a battle cry for many executives demanding that any new HR initiative shows its value before its implementation. Executives are also curious to know the Return on Investment (ROI) of initiatives once they have been implemented. [i.e. “Did we hit our target?”] A sensible request, given that people make up between 40 to 80 percent of a business operating costs. –Deloitte, 2014 [i.e. “Are we now more profitable as an organization as a result?”]
Deloitte also reports that up to 90 percent of most companies operating expenses go toward meeting compensation, benefits, and other employee-related expenses. It’s only natural that a cost-conscious executive would ask if the money that was invested in the HR-led initiative actually led to a positive result.
Case Study 01
Reducing Turnover from 12% to 10% saved this company half a million dollars
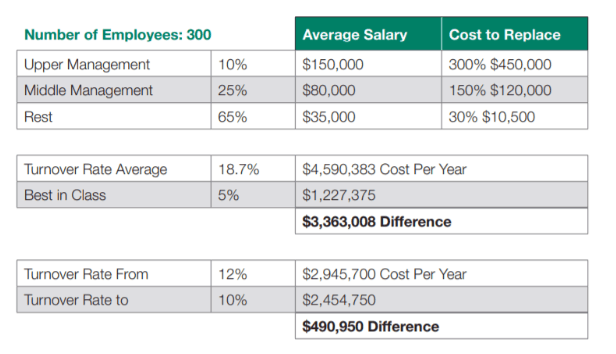
It started with a savvy HR director. She asked the question: “How much does it cost our 300-person company when someone in upper or middle management terminates employment?” She then calculated the numbers and found that the turnover rate was 12 percent, and created initiatives to reduce it to 10 percent. This difference was valued at $490,950 – almost half a million dollars!
👆 this case is exactly the type of “stars-aligned” example we look for when attempting to quantify the ROI of HR 👆
A Call to HR Leaders to be More Quantitative
In this article, you’ll learn how to make the business case to your executives and secure funding for your HR project. One bank executive neatly encapsulated the point when he said: “HR needs to talk to me in Excel, not PowerPoint!” Too often as HR leaders, we make the case using words, not numbers. Executives like to see numbers. CFOs like to be able to quantify projected benefits before rushing in and making a decision that involves allocating budget towards yet another HR-led effort. If your goal as an HR leader is to be able to say 🙌 “We just saved the company half a million dollars a year” 🙌 then we need to take a cold, hard look at the human capital value of the work teams under your supervision.
Hopefully, you’ll learn to be less qualitative and give that report to your boss in Excel, not PowerPoint 😉
[Later we’ll look at two more successful case studies. But first, we’ll cover how to calculate ROI, (and why human behavior is so tricky to measure)!]
Why It’s Difficult to Calculate the Return on Investment of Human Capital
Can people and human behavior be reduced to numbers?
It truly is difficult to calculate the ROI of human capital. That’s because the final analysis largely rests on subjective and behavioral data, not financial data.
“Numbers don’t lie. Let’s just make sure we measure the right ones.” -Jack Welch
How Data is Collected in HR
Data can be collected using a variety of methods, such as:
• Follow-up surveys and questionnaires to measure satisfaction and reactions from
stakeholders, as well as uncover specific application issues with HR programs.
• On-the-job observation to capture application and use.
• Tests and assessments to measure the extent of learning.
• Interviews to measure reaction and determine the extent to which the program has been implemented.
• Focus groups to determine the degree of application of the HR program in job situations.
• Action plans to show progress with implementation on the job and the impact obtained.
• Business performance monitoring to show improvement in various performance records and operational data.
The most popular ways data is collected is through questionnaires, surveys, direct observation, and manager feedback.
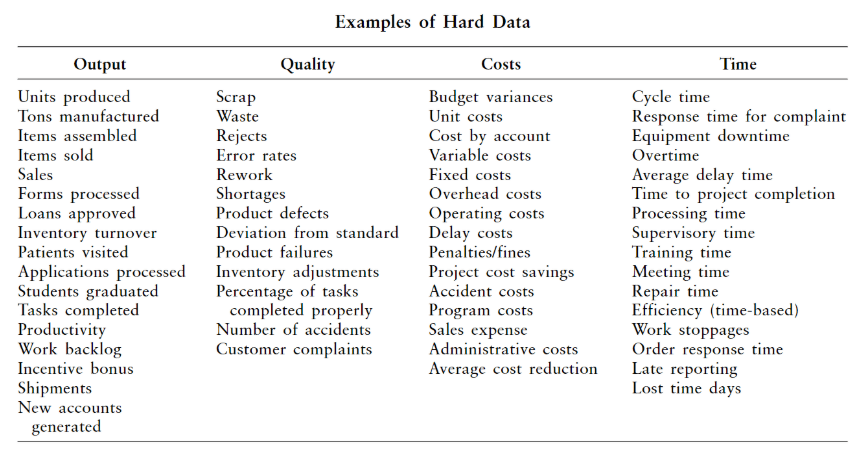
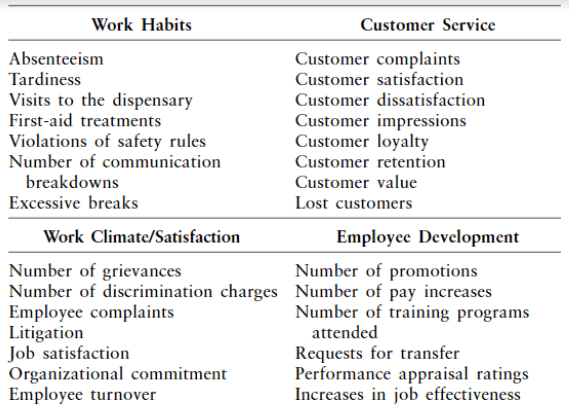
Hard Data vs. Soft Data (You can collect both)
Here is a list of metrics that you can define, measure, and optimize over time. We sort these metrics by
- hard data (which you can obtain from the operations department)
- soft data (which you may need to measure yourself through surveys and questionnaires).
Let’s put this into practice with an example: reducing absenteeism.
Reducing Absenteeism
One of the original authors that focused on the ROI of HR, (and the inspiration for much of this article) begins with the research done by Jack J. Phillips, Ron Stone, and Patricia Phillips. These researchers equipped the Human Resources director with the boxing gloves needed to face down the champion CFO. (The CFO that’s always asking “Show me the money” before willing to allocate capital to any initiative). These researchers moved Human Resources from a “light and fluffy” approach into a “float like a butterfly, sting like a bee” strategy.

These researchers gave HR the quantitative muscle to step into the ring (and defend their new training program, or make the case for additional Sexual Harassment training in the organization).
Their first step? A needs analysis. This step is crucial, so here’s a list of ‘needs analysis’ templates to get you started.
In this case, let’s start with a needs analysis to reduce absenteeism.
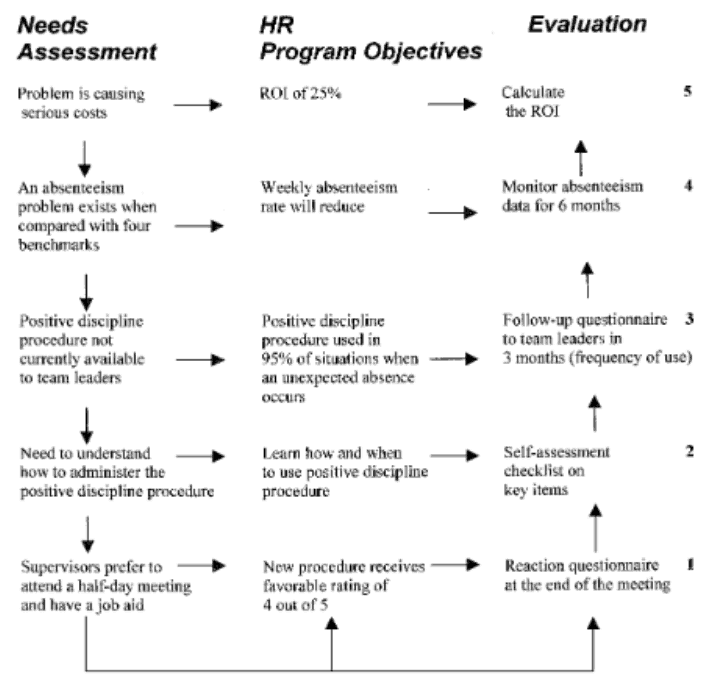
Step 1: Monitor absenteeism through questionnaires and surveys
Step 2: Determine HR Program Objectives
Step 3: Evaluate and administer positive discipline procedures to see if behavior changes for the better
Step 4: Provide additional training and administer reaction questionnaires
Step 5: Crunch the numbers a few weeks later and see if the intervention worked
Case Studies
Here are some additional case studies. These are focused on Wellness Programs and Customer Satisfaction, respectively.
Case Study 02
Wellness Programs Demonstrating a 300% Return
When Alticor, a division of Amway, instituted a wellness program that focused on mind, body, and heart, it featured programs that included achieving personal optimal health, encouraging personal accountability in managing health, and showing employees how to reduce their stress levels. 65% of their employees participated in the program at a cost to Alticor of $442 per employee with a projected return of $3 for every $1 spent. Other studies and programs show similar returns on this type of investment of around 300%. Source
Case Study 03
Bank Teller Training Increases Customer Satisfaction
After a teller training program was conducted after a bank merger, market research data showed that the percentage of customers who were dissatisfied with teller knowledge had been reduced by 5 percent when compared with market survey data before training. Because Teller knowledge was increased by training, the 5 percent reduction of dissatisfied customers was directly attributable to the training program.
| “While accounting for labor is not an asset that would be shown in a Balance Sheet, in practical terms labor is one of the most important assets of a business.” – Collier (2009, p.340) |
An Invitation to See Human Capital as a Hard-Cost
You can measure just about anything.
Financial analysts working on Wall Street attempt to measure the “pulse of the market.” They make bets on when the next market correction will occur. They attempt to understand the system that will cause a loss or a gain.
Military strategists measure the likelihood that a naval war erupts in the Gulf of Aden. A war here, in one of the biggest shipping corridors in the world would involve many countries, including the U.S. Saudia Arabia, Israel, China, and Russia. Important information to know when setting policy or allocating military budget spend.
So it’s not out of the question to think that you can quantify the very human behaviors that reflect the “health” of your organization. (You may need to brush up on your statistics, and even learn a thing or two about confidence-intervals or artificial intelligence, but it’s totally possible)!
In this article we showed you how to calculate both hard and soft metrics. We looked at different examples, including turnover, absenteeism, wellness programs, and customer satisfaction. We wrote this article in hopes that you the HR leader, like Muhammad Ali, can come back strong to the executives and proudly say “Our initiative saved the company half a million dollars a year!”
Let us know how it goes. If you’d like any additional data on calculating the Return on Investment of an HR-led strategy email us at tammy@kleinhrsolutions.com – we’re happy to help out our HR people!
To hire Tammy as your HR Outsourced solution
- fill out the Contact Us form
- email tammy@kleinhrsolutions.com
- call Tammy directly at 305-775-5640